I'm a big fan of Atlassian products, in particular Jira and Confluence, and I've already mentioned how helpful they have been in my previous projects
If you're not already using them, you should. And you should be using them together.
Why?
First the obvious :
You can manage sprints with the Meeting notes Blueprint and Retrospectives Blueprint
You can display Confluence info in JIRA - Links requirements in confluence in jira tasks using the Product Requirements Blueprint
The last point is really my favorite.
Assume you are managing a team of developers in a large organization, and upper management would like periodic status updates of the team's performance. You could show them burn down charts, or really any of the plethora of charts that Jira offers out of the box, but what if they wanted more info? What if they wanted to see, for example,
I'll explain how to get the info for time to market. The other two are just a matter of getting different info from the JSON retrieved by the Jira REST API, and some bash magic
Release 1 looked like this:
Release 2 looked like this:
Release 3 was unreleased, so we won't bother about it.
2. I also used the Confluence free trial. I created a space called "Moon Rocket Launch Info", and a page to display graphs in, called "Time to market graph"
3. I had the beautiful JQ JSON parser for bash installed (https://stedolan.github.io/jq/)
This search returns a bunch of results that looks like this:
We can use curl to get these results into our script:
This returns a LOT of info about each jira tasks. In fact, each Jira issue returned looks like this, with a whole lot of info:
What we are interested in is only the version, resolutionDate and createdDate. Running the jira response via JQ to filter these results:
Returns an array of elements that look like this:
Now its just a matter of some bash magic to get the info from this array and present it to confluence. The full is available on github here: https://github.com/somaiah/jira-confluence-graphs/blob/master/src/timeToMarket.sh
But the final HTML to be sent to confluence looks like this:
Now you just need to update the page in confluence with a REST PUT:
The confluence page ID is the ID of the page you created (see assumptions)
The page name is the page title
The space key is the confluence space your page is in
The content is a code generated.
The page version should be updated by 1
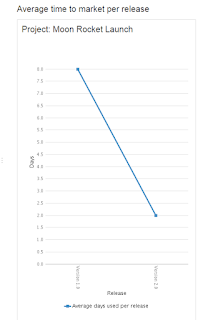
The resulting graph on confluence looks like this:
If you are using Jenkins for CI, you can simply stick this script in Jenkins, and run it periodically (say every 2 weeks or so on)
Now you have a nice visual display of your TTM, thats automatically updated without any manual interevention. Neat?
As you can guess from the Jira info that's returned in the REST call, you can do a whole bunch of stuff - as I said before, delivery quality and productivity are only 2 of them. Simply tailor your JQL and you're set.
You can find the full code on github: https://github.com/somaiah/jira-confluence-graphs
Since I used the trial versions of jira and confluence, the responses and requests are saved in https://github.com/somaiah/jira-confluence-graphs/tree/master/resources
If you're not already using them, you should. And you should be using them together.
Why?
First the obvious :
You can manage sprints with the Meeting notes Blueprint and Retrospectives Blueprint
You can turn your Confluence into a knowledgebase. Everything is searchable and editing docs is easy. If you keep all your docs on Confluence, everyone always knows where info is. Of course confluence allows you to protect sensitive areas with password protection, so your knowledgebase can only reveal stuff you want to.
You can display Confluence info in JIRA - Links requirements in confluence in jira tasks using the Product Requirements Blueprint
But the real beauty of integrating Jira and Confluence is when you can display Jira data in Confluence.
For example:
- Display JIRA data like status reports and change logs in Confluence with JIRA reports Blueprint
- Automatic linking in confluence to Jira tasks
- Embed Jira Queries into Confluence to show task lists - for example to show which tasks are included in a release
- Use the Jira Chart Macro to show the results of a Jira query (JQL) as a chart in Confluence
- Use the Jira REST API to get detailed info about tasks. Search queries are returned as JSON objects which can be parsed and used to display charts on confluence with the confluence REST API
The last point is really my favorite.
Assume you are managing a team of developers in a large organization, and upper management would like periodic status updates of the team's performance. You could show them burn down charts, or really any of the plethora of charts that Jira offers out of the box, but what if they wanted more info? What if they wanted to see, for example,
- How long a release took to implement (time to market)?
- Or how many bugs were found in each delivery (delivery quality)?
- Or what percent of each delivery was defects vs enhancements (productivity)?
I'll explain how to get the info for time to market. The other two are just a matter of getting different info from the JSON retrieved by the Jira REST API, and some bash magic
Assumptions:
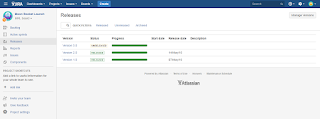
1. For this example, I used the free Jira trial, and created 2 releases. My Jira looked like this:
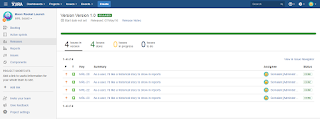
Release 1 looked like this:

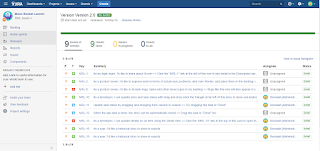
Release 2 looked like this:

Release 3 was unreleased, so we won't bother about it.
2. I also used the Confluence free trial. I created a space called "Moon Rocket Launch Info", and a page to display graphs in, called "Time to market graph"
3. I had the beautiful JQ JSON parser for bash installed (https://stedolan.github.io/jq/)
The code
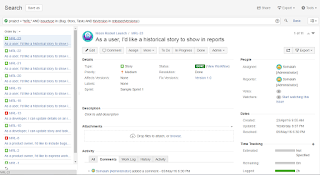
Lets say I am interested in Bug, Story and Task issues. My JQL would look like this:project = "MRL" AND issuetype in (Bug, Story, Task) AND fixVersion in releasedVersions()
This search returns a bunch of results that looks like this:

We can use curl to get these results into our script:
JIRA_REST_API_URL="https://somaiah.atlassian.net/rest/api/2"
JIRA_USER="admin"
JIRA_PASSWORD="secret"

JIRA_SEARCH_URL="${JIRA_REST_API_URL}/search?jql=project=%22MRL%22%20AND%20issuetype%20in%20(Bug,%20Story,%20Task)%20AND%20fixVersion%20in%20releasedVersions()"

JIRA_FILTER_INFO=`curl --globoff --insecure --silent -u ${JIRA_USER}:${JIRA_PASSWORD} -X GET -H 'Content-Type: application/json' "${JIRA_SEARCH_URL}"`
This returns a LOT of info about each jira tasks. In fact, each Jira issue returned looks like this, with a whole lot of info:
    {
        "expand": "operations,versionedRepresentations,editmeta,changelog,renderedFields",
        "id": "10021",
        "self": "https://somaiah.atlassian.net/rest/api/2/issue/10021",
        "key": "MRL-22",
        "fields": {
            "issuetype": {
                "self": "https://somaiah.atlassian.net/rest/api/2/issuetype/10001",
                "id": "10001",
                "description": "gh.issue.story.desc",
                "iconUrl": "https://somaiah.atlassian.net/images/icons/issuetypes/story.svg",
                "name": "Story",
                "subtask": false
            },
            "timespent": 21600,
            "project": {
                "self": "https://somaiah.atlassian.net/rest/api/2/project/10000",
                "id": "10000",
                "key": "MRL",
                "name": "Moon Rocket Launch",
                "avatarUrls": {
                    "48x48": "https://somaiah.atlassian.net/secure/projectavatar?avatarId=10324",
                    "24x24": "https://somaiah.atlassian.net/secure/projectavatar?size=small&avatarId=10324",
                    "16x16": "https://somaiah.atlassian.net/secure/projectavatar?size=xsmall&avatarId=10324",
                    "32x32": "https://somaiah.atlassian.net/secure/projectavatar?size=medium&avatarId=10324"
                }
            },
            "fixVersions": [
                {
                    "self": "https://somaiah.atlassian.net/rest/api/2/version/10000",
                    "id": "10000",
                    "name": "Version 1.0",
                    "archived": false,
                    "released": true,
                    "releaseDate": "2016-05-07"
                }
            ],
            "aggregatetimespent": 21600,
            "resolution": {
                "self": "https://somaiah.atlassian.net/rest/api/2/resolution/10000",
                "id": "10000",
                "description": "Work has been completed on this issue.",
                "name": "Done"
            },
            "resolutiondate": "2016-05-03T16:52:16.000+0200",
            "workratio": -1,
            "lastViewed": "2016-05-15T21:35:37.060+0200",
            "watches": {
                "self": "https://somaiah.atlassian.net/rest/api/2/issue/MRL-22/watchers",
                "watchCount": 0,
                "isWatching": false
            },
            "created": "2016-04-23T09:55:16.000+0200",
            "customfield_10022": 2.0,
            "priority": {
                "self": "https://somaiah.atlassian.net/rest/api/2/priority/3",
                "iconUrl": "https://somaiah.atlassian.net/images/icons/priorities/medium.svg",
                "name": "Medium",
                "id": "3"
            },
            "labels": [],
            "customfield_10016": "0|i0004n:",
            "customfield_10017": ["com.atlassian.greenhopper.service.sprint.Sprint@14c71ff[id=2,rapidViewId=1,state=CLOSED,name=Sample Sprint 1,startDate=2016-04-23T09:55:19.342+02:00,endDate=2016-05-07T09:55:19.342+02:00,completeDate=2016-05-07T08:35:19.342+02:00,sequence=2]"],
            "customfield_10018": null,
            "timeestimate": 0,
            "aggregatetimeoriginalestimate": null,
            "versions": [],
            "issuelinks": [],
            "assignee": {
                "self": "https://somaiah.atlassian.net/rest/api/2/user?username=admin",
                "name": "admin",
                "key": "admin",
                "emailAddress": "somaiah@gmail.com",
                "avatarUrls": {
                    "48x48": "https://somaiah.atlassian.net/secure/useravatar?avatarId=10351",
                    "24x24": "https://somaiah.atlassian.net/secure/useravatar?size=small&avatarId=10351",
                    "16x16": "https://somaiah.atlassian.net/secure/useravatar?size=xsmall&avatarId=10351",
                    "32x32": "https://somaiah.atlassian.net/secure/useravatar?size=medium&avatarId=10351"
                },
                "displayName": "Somaiah  [Administrator]",
                "active": true,
                "timeZone": "Europe/Berlin"
            },
            "updated": "2016-05-14T20:37:11.000+0200",
            "status": {
                "self": "https://somaiah.atlassian.net/rest/api/2/status/10001",
                "description": "",
                "iconUrl": "https://somaiah.atlassian.net/",
                "name": "Done",
                "id": "10001",
                "statusCategory": {
                    "self": "https://somaiah.atlassian.net/rest/api/2/statuscategory/3",
                    "id": 3,
                    "key": "done",
                    "colorName": "green",
                    "name": "Done"
                }
            },
            "components": [],
            "timeoriginalestimate": null,
            "description": null,
            "customfield_10010": null,
            "customfield_10011": null,
            "customfield_10012": null,
            "customfield_10013": null,
            "customfield_10014": "Not started",
            "customfield_10015": null,
            "customfield_10005": null,
            "customfield_10006": null,
            "customfield_10007": null,
            "customfield_10008": null,
            "customfield_10009": null,
            "aggregatetimeestimate": 0,
            "summary": "As a user, I'd like a historical story to show in reports",
            "creator": {
                "self": "https://somaiah.atlassian.net/rest/api/2/user?username=admin",
                "name": "admin",
                "key": "admin",
                "emailAddress": "somaiah@gmail.com",
                "avatarUrls": {
                    "48x48": "https://somaiah.atlassian.net/secure/useravatar?avatarId=10351",
                    "24x24": "https://somaiah.atlassian.net/secure/useravatar?size=small&avatarId=10351",
                    "16x16": "https://somaiah.atlassian.net/secure/useravatar?size=xsmall&avatarId=10351",
                    "32x32": "https://somaiah.atlassian.net/secure/useravatar?size=medium&avatarId=10351"
                },
                "displayName": "Somaiah  [Administrator]",
                "active": true,
                "timeZone": "Europe/Berlin"
            },
            "subtasks": [],
            "reporter": {
                "self": "https://somaiah.atlassian.net/rest/api/2/user?username=admin",
                "name": "admin",
                "key": "admin",
                "emailAddress": "somaiah@gmail.com",
                "avatarUrls": {
                    "48x48": "https://somaiah.atlassian.net/secure/useravatar?avatarId=10351",
                    "24x24": "https://somaiah.atlassian.net/secure/useravatar?size=small&avatarId=10351",
                    "16x16": "https://somaiah.atlassian.net/secure/useravatar?size=xsmall&avatarId=10351",
                    "32x32": "https://somaiah.atlassian.net/secure/useravatar?size=medium&avatarId=10351"
                },
                "displayName": "Somaiah  [Administrator]",
                "active": true,
                "timeZone": "Europe/Berlin"
            },
            "customfield_10000": null,
            "aggregateprogress": {
                "progress": 21600,
                "total": 21600,
                "percent": 100
            },
            "customfield_10001": "10000_*:*_1_*:*_889020000_*|*_10001_*:*_1_*:*_0",
            "customfield_10002": "com.atlassian.servicedesk.plugins.approvals.internal.customfield.ApprovalsCFValue@37e4eb",
            "customfield_10003": null,
            "customfield_10004": null,
            "environment": null,
            "duedate": null,
            "progress": {
                "progress": 21600,
                "total": 21600,
                "percent": 100
            },
            "votes": {
                "self": "https://somaiah.atlassian.net/rest/api/2/issue/MRL-22/votes",
                "votes": 0,
                "hasVoted": false
            }
        }
    }
What we are interested in is only the version, resolutionDate and createdDate. Running the jira response via JQ to filter these results:
echo ${JIRA_FILTER_INFO} | jq -r '.issues | map(.fields | (.fixVersions[] | { version: .name }) + { resolutionDate: .resolutiondate} + {createdDate: .created})'`
Returns an array of elements that look like this:
  {
    "version": "Version 1.0",
    "resolutionDate": "2016-05-05T18:30:16.000+0200",
    "createdDate": "2016-04-23T09:55:16.000+0200"
  },
  {
    "version": "Version 1.0",
    "resolutionDate": "2016-05-03T16:52:16.000+0200",
    "createdDate": "2016-04-23T09:55:16.000+0200"
  }
Now its just a matter of some bash magic to get the info from this array and present it to confluence. The full is available on github here: https://github.com/somaiah/jira-confluence-graphs/blob/master/src/timeToMarket.sh
But the final HTML to be sent to confluence looks like this:
<h2>Average time to market per release </h2>
<table>
<tbody>
<tr>
<td>
<h2>Project: Moon Rocket Launch</h2>
<div style='line-height:50px;'><br/></div>
<ac:macro ac:name='chart'>
<ac:parameter ac:name='type'>line</ac:parameter>
<ac:parameter ac:name='width'>400</ac:parameter>
<ac:parameter ac:name='height'>600</ac:parameter>
<ac:parameter ac:name='forgive'>true</ac:parameter>
<ac:parameter ac:name='xLabel'>Release</ac:parameter>
<ac:parameter ac:name='yLabel'>Days</ac:parameter>
<ac:parameter ac:name='categoryLabelPosition'>down90</ac:parameter>
<ac:rich-text-body>
<table>
<tbody>
<tr>
<th><p> </p></th>
<th><p> Version 1.0</p></th>
<th><p> Version 2.0</p></th>
</tr>
<tr>
<td><p>Average days used per release</p></td>
<td><p>8</p></td>
<td><p>2</p></td>
</tr>
</tbody>
</table>
</ac:rich-text-body>
</ac:macro>
<div style='line-height:50px;'><br/></div>
</td>
</tr>
</tbody>
</table>
Now you just need to update the page in confluence with a REST PUT:
echo '{"id":"'${CONFLUENCE_PAGE_ID}'","type":"page","title":"'${PAGE_NAME}'","space":{"key":"'${CONFLUENCE_SPACE}'"},"body":{"storage":{"value":"'${CONTENT}'","representation":"storage"}},"version":{"number":'${NEXT_PAGE_VERSION}'}}' > body.json

RESPONSE=`curl --globoff --insecure --silent -u ${CONFLUENCE_USER}:${CONFLUENCE_PASSWORD} -X PUT -H 'Content-Type: application/json' --data @body.json ${CONFLUENCE_REST_API_PAGE_URL}/${CONFLUENCE_PAGE_ID}`
The confluence page ID is the ID of the page you created (see assumptions)
The page name is the page title
The space key is the confluence space your page is in
The content is a code generated.
The page version should be updated by 1
The resulting graph on confluence looks like this:
If you are using Jenkins for CI, you can simply stick this script in Jenkins, and run it periodically (say every 2 weeks or so on)
Now you have a nice visual display of your TTM, thats automatically updated without any manual interevention. Neat?
As you can guess from the Jira info that's returned in the REST call, you can do a whole bunch of stuff - as I said before, delivery quality and productivity are only 2 of them. Simply tailor your JQL and you're set.
You can find the full code on github: https://github.com/somaiah/jira-confluence-graphs
Since I used the trial versions of jira and confluence, the responses and requests are saved in https://github.com/somaiah/jira-confluence-graphs/tree/master/resources
No comments:
Post a Comment